Run 3 / √s = 13.6 TeV / Warwick // 2025–26
Measuring
B-meson decays.
How a final-year particle-physics project separated two B-meson decays, tested the mass model, and turned fitted yields into decay probabilities.
00 / Before the data
What is
being measured?
- 01 Flavour
- Quarks come in six species, called flavours: up, down, strange, charm, bottom and top. Flavour labels which quark is present; it is not a taste or colour.
- 02 Two interactions
- The strong interaction binds quarks into hadrons and governs how the outgoing quarks reorganise. It conserves net quark flavour. The weak interaction can change flavour, so it allows the anti-bottom constituent in this decay to become anti-charm.
- 03 Mesons and B mesons
- A meson is a quark–antiquark bound state. A B meson contains a bottom or anti-bottom quark; here the neutral B0 contains an anti-bottom and a down quark. Its lifetime is so short that the detector reconstructs its decay products instead of seeing the B0 directly.
- 04 The two modes
- Both modes have the form B0 → D−h+. The bachelor h+, produced directly at the B vertex, is π+ in the more common Dπ mode or K+ in the CKM-suppressed DK mode. Comparing their rates tests the weak coupling and the strong-interaction calculation used for hadronic decays.
DπB0 → D−π+larger weak coupling
DKB0 → D−K+CKM suppressed
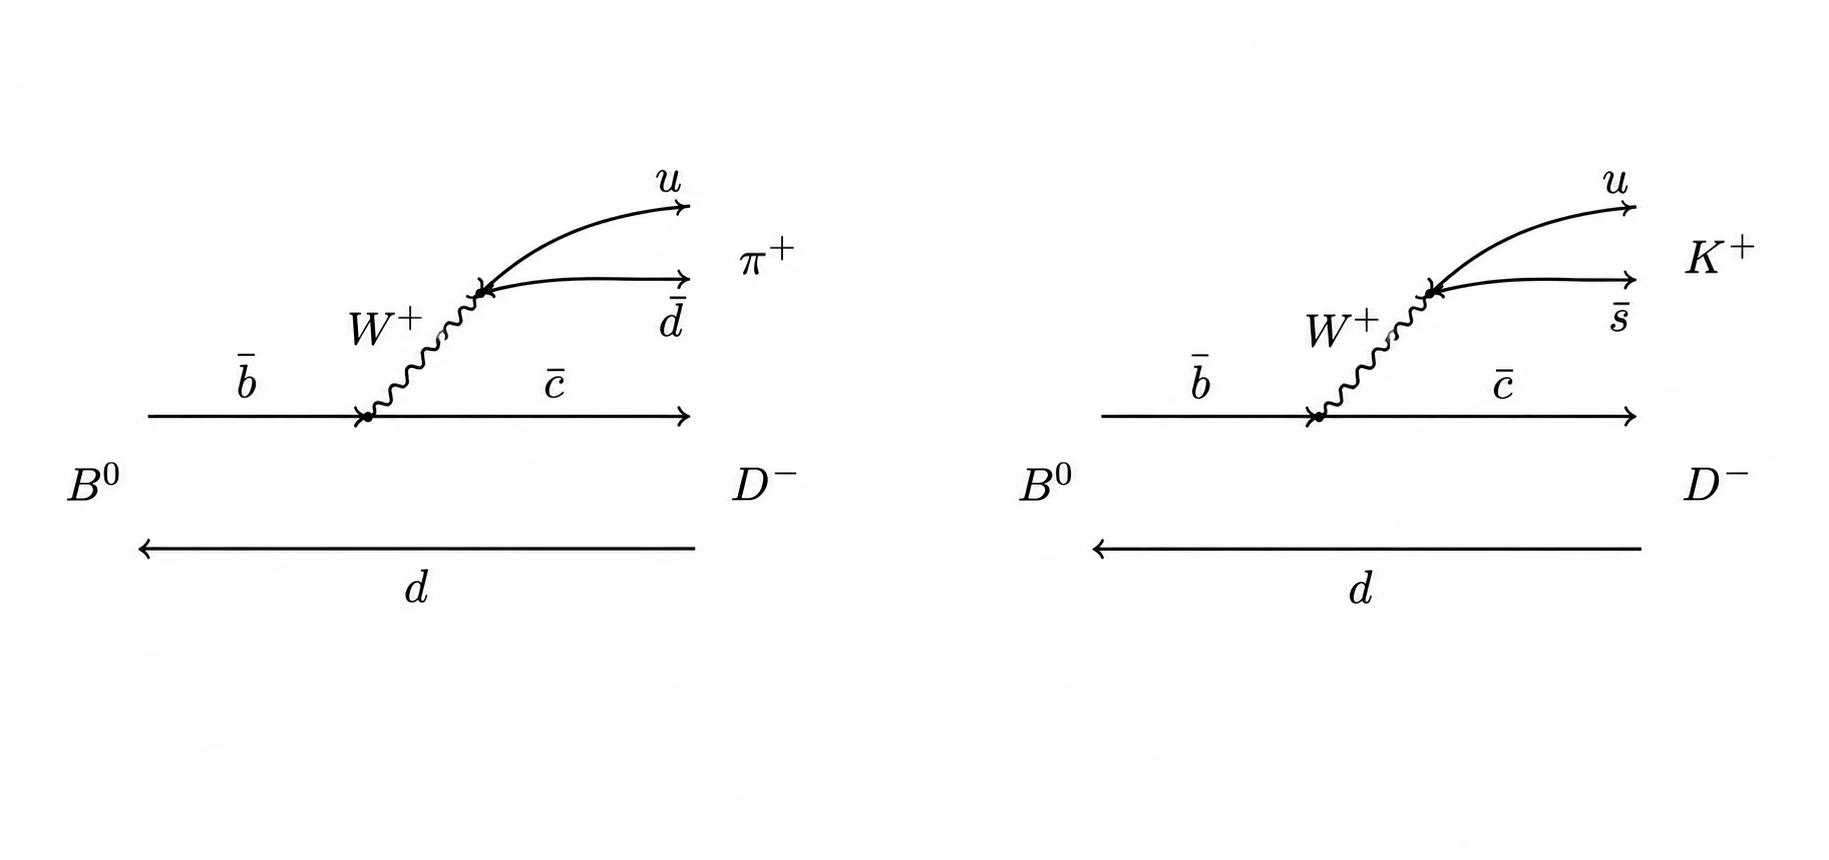
One weak decay, two possible bachelor particles.
These are quantum-process diagrams, not tracks through the detector. The anti-bottom changes flavour through a virtual W+; the spectator down quark continues into the D−. The W products form either π+ or K+. The smaller weak coupling suppresses the kaon route, while strong-interaction effects still influence the measurable rate.
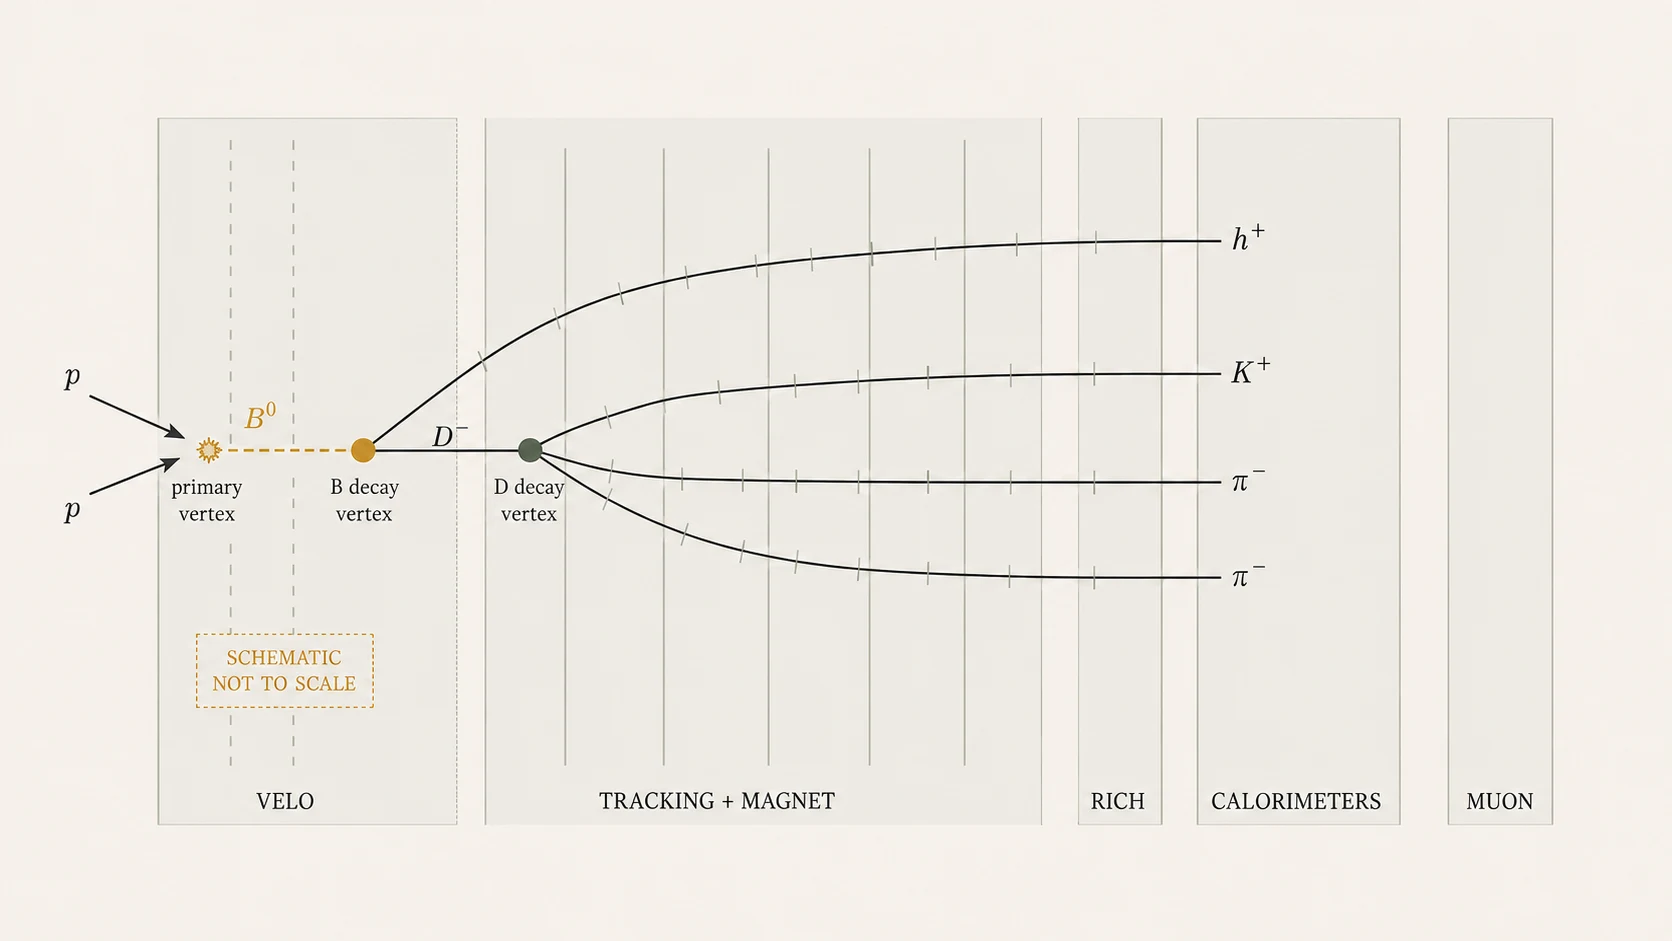
The detector sees the aftermath.
The VELO separates the proton collision point from the nearby B0 and D− decay vertices. Tracking stations and the magnet measure momentum from each charged path’s curvature. The RICH adds particle-identification information that helps distinguish pions from kaons. Calorimeters measure particle showers; the downstream muon system is shown for context and is especially useful for the J/ψ control channel used in the academic analysis. Distances and bends are not to scale.
- Candidate
- A combination of measured tracks consistent with one possible decay.
- Vertex
- A reconstructed point where particles were produced or decayed.
- Mass hypothesis
- The pion or kaon identity assigned to a track when calculating its energy.
Loading the synthetic demonstration…
08 / Normalisation channel
Measure against
a clean reference.
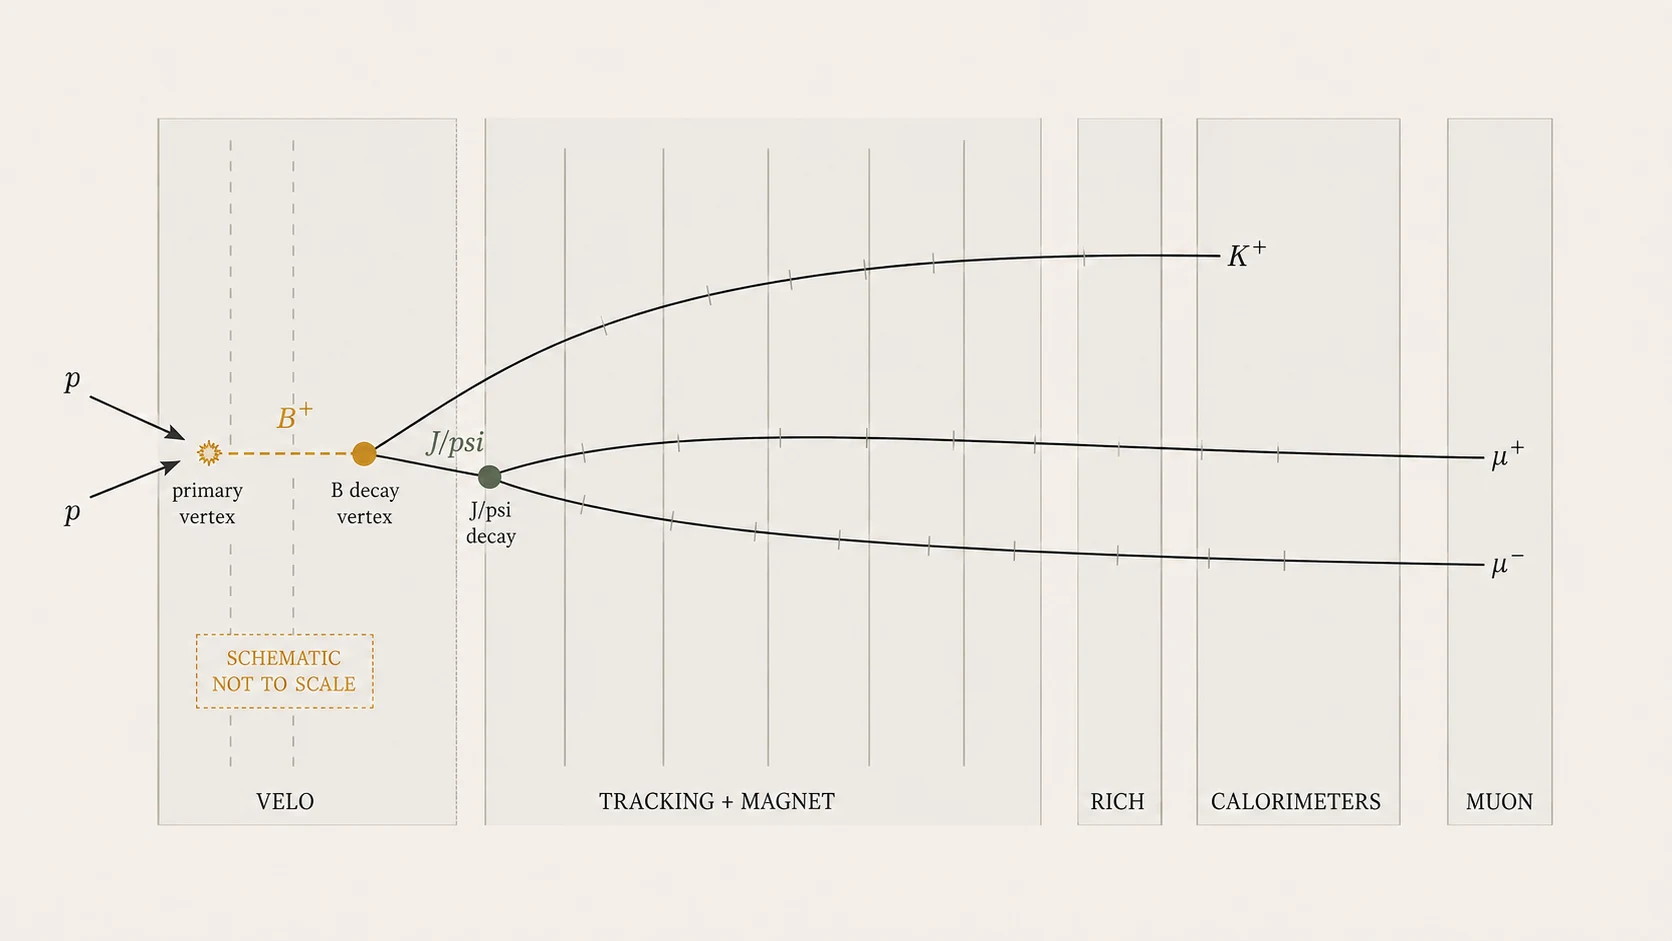
A known yardstick reduces what has to be known absolutely.
The control decay B+ → J/ψK+, with J/ψ → μ+μ−, produces a prominent mass peak. Comparing the hadronic signal yields with this reference removes the unknown total number of produced beauty hadrons and lets some shared efficiencies cancel in a ratio.
The cancellation is not complete: the final calculation still needs relative detector efficiencies, fragmentation information, and external branching fractions.
J/ψK+ mass and pulls
Synthetic data Total model Signal Combinatorial
09 / From yields to rates
The reported
student results.
Start with a counted yieldNf = Nb b̄ fq ℬ(Bq → f) ∏ℬi εf
Divide signal by referenceNDh / NJ/ψKeff
The unknown production count cancelsNb b̄ / Nb b̄ = 1
Normalisation removes the unknown total number of produced beauty pairs. It does not remove every uncertainty: the calculation still needs the relative efficiencies, the B+/B0 fragmentation ratio, daughter-decay probabilities and the luminosity-scaled reference yield.
Reported student analysis / Dπ(2.614 ± 0.003stat ± 0.098ext) × 10−3
Reported student analysis / DK(2.363 ± 0.010stat ± 0.089ext) × 10−4
Reported ratio / K to π0.09040 ± 0.00039stat ± 0.00231ext
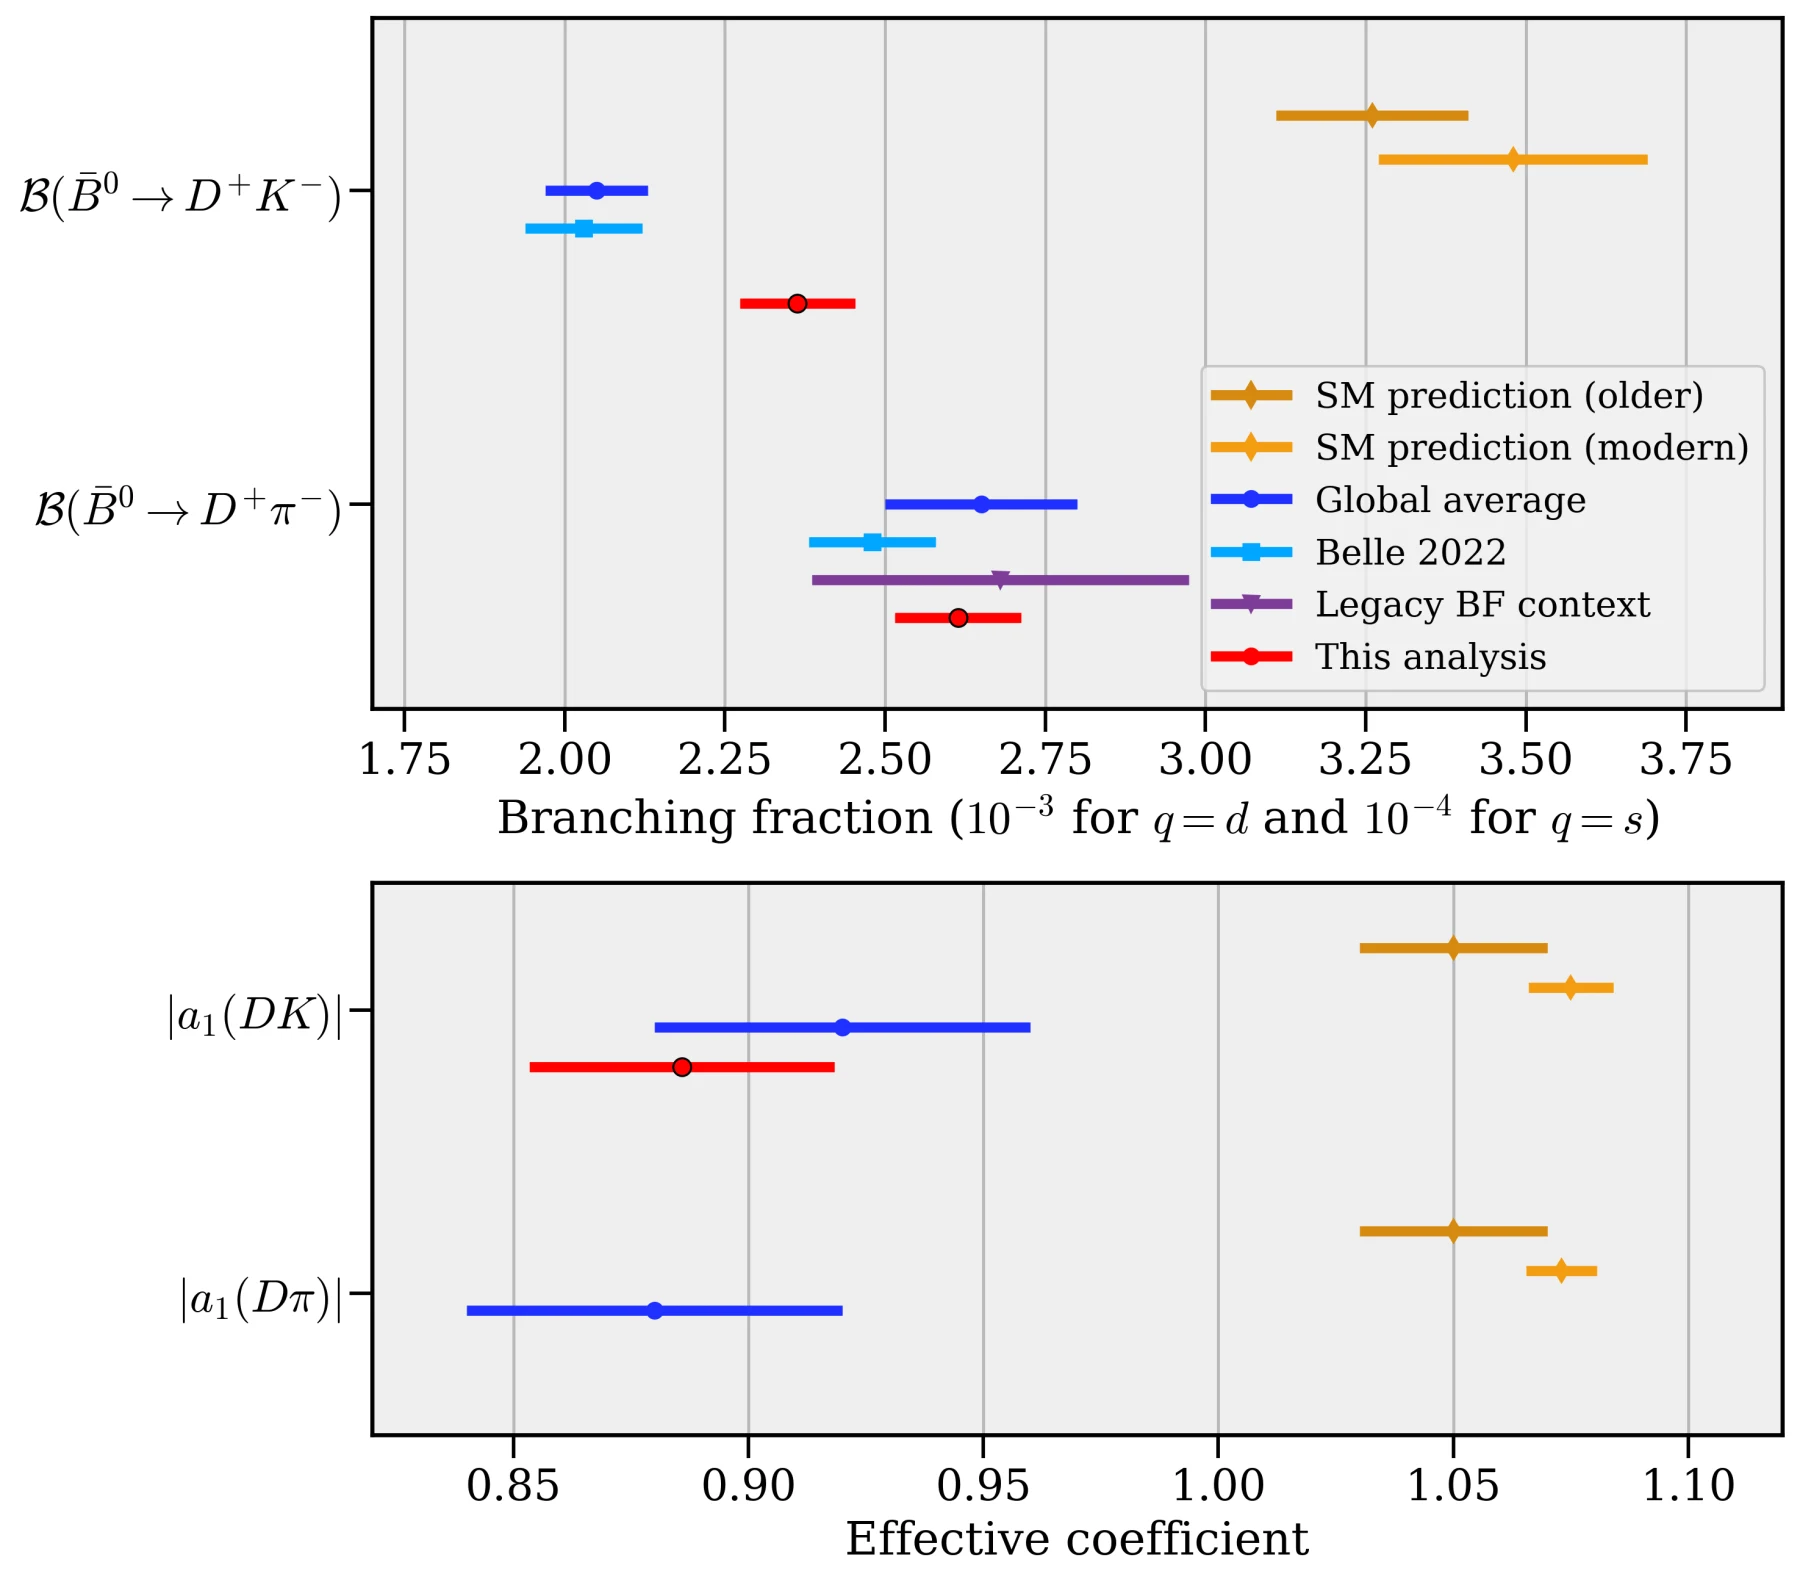
What the “anomaly” means here.
The established b → cūq tension is a pattern in which measured non-leptonic B-decay rates sit below modern QCD-factorisation predictions. It is a disagreement between measurements and a theory calculation, not proof of a new particle. In this student analysis, Dπ was within 0.82σ of the global average and 3.60σ below the quoted QCDF expectation; DK was 2.61σ above the global average yet remained 6.16σ below that expectation.
Those comparisons come from the dissertation and do not establish a new anomaly. The quoted “ext” term propagates external inputs; a full collaboration-level systematic evaluation was outside the project scope.
10 / Original academic project
Back to the
student analysis.
This was my final-year University of Warwick research project using supplied LHCb Run-3 collision data. It was student coursework, not employment by CERN or LHCb, and it is not an official or published LHCb result.
CP-Averaged Branching Fractions for B0 → D−h+ with Leptonic Normalisation in LHCb Run-3
Collision energy: 13.6 TeV
Student project downloads
Read the submitted work behind this portfolio explanation. These are student academic materials, not official LHCb publications.
Tools
Methods
- Event selection
- Punzi-style optimisation
- PID and misidentification studies
- Maximum-likelihood modelling
- Simultaneous fits
- Model validation
- Uncertainty analysis
Original student analysis / fitted signal yields
What validation revealed
Useful limits are part of a result.
- Misidentification modelling was difficult, and some mass regions remained imperfectly described.
- External inputs contributed uncertainty.
- Numerical convergence was not enough to establish a good model.
- A full collaboration-level analysis would require more systematic treatment.
I used an existing MVA/XGBoost score in event-selection optimisation; I did not train that model. The student analysis compared its derived value with an existing branching-fraction tension, but did not establish a new anomaly.